Originally posted on Writing it Out
by William Walker, senior writing coach
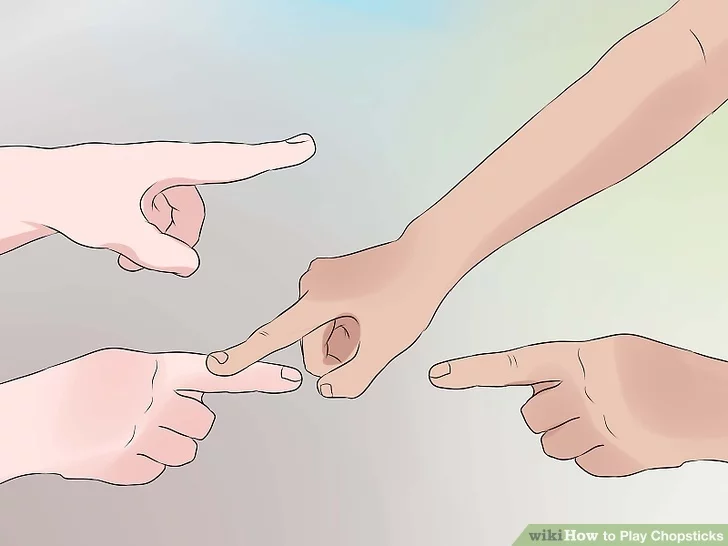
At the start of September, I was riding in the band bus on the way back from the State Fair, and I started thinking about chopsticks. Like the finger game.
Could I
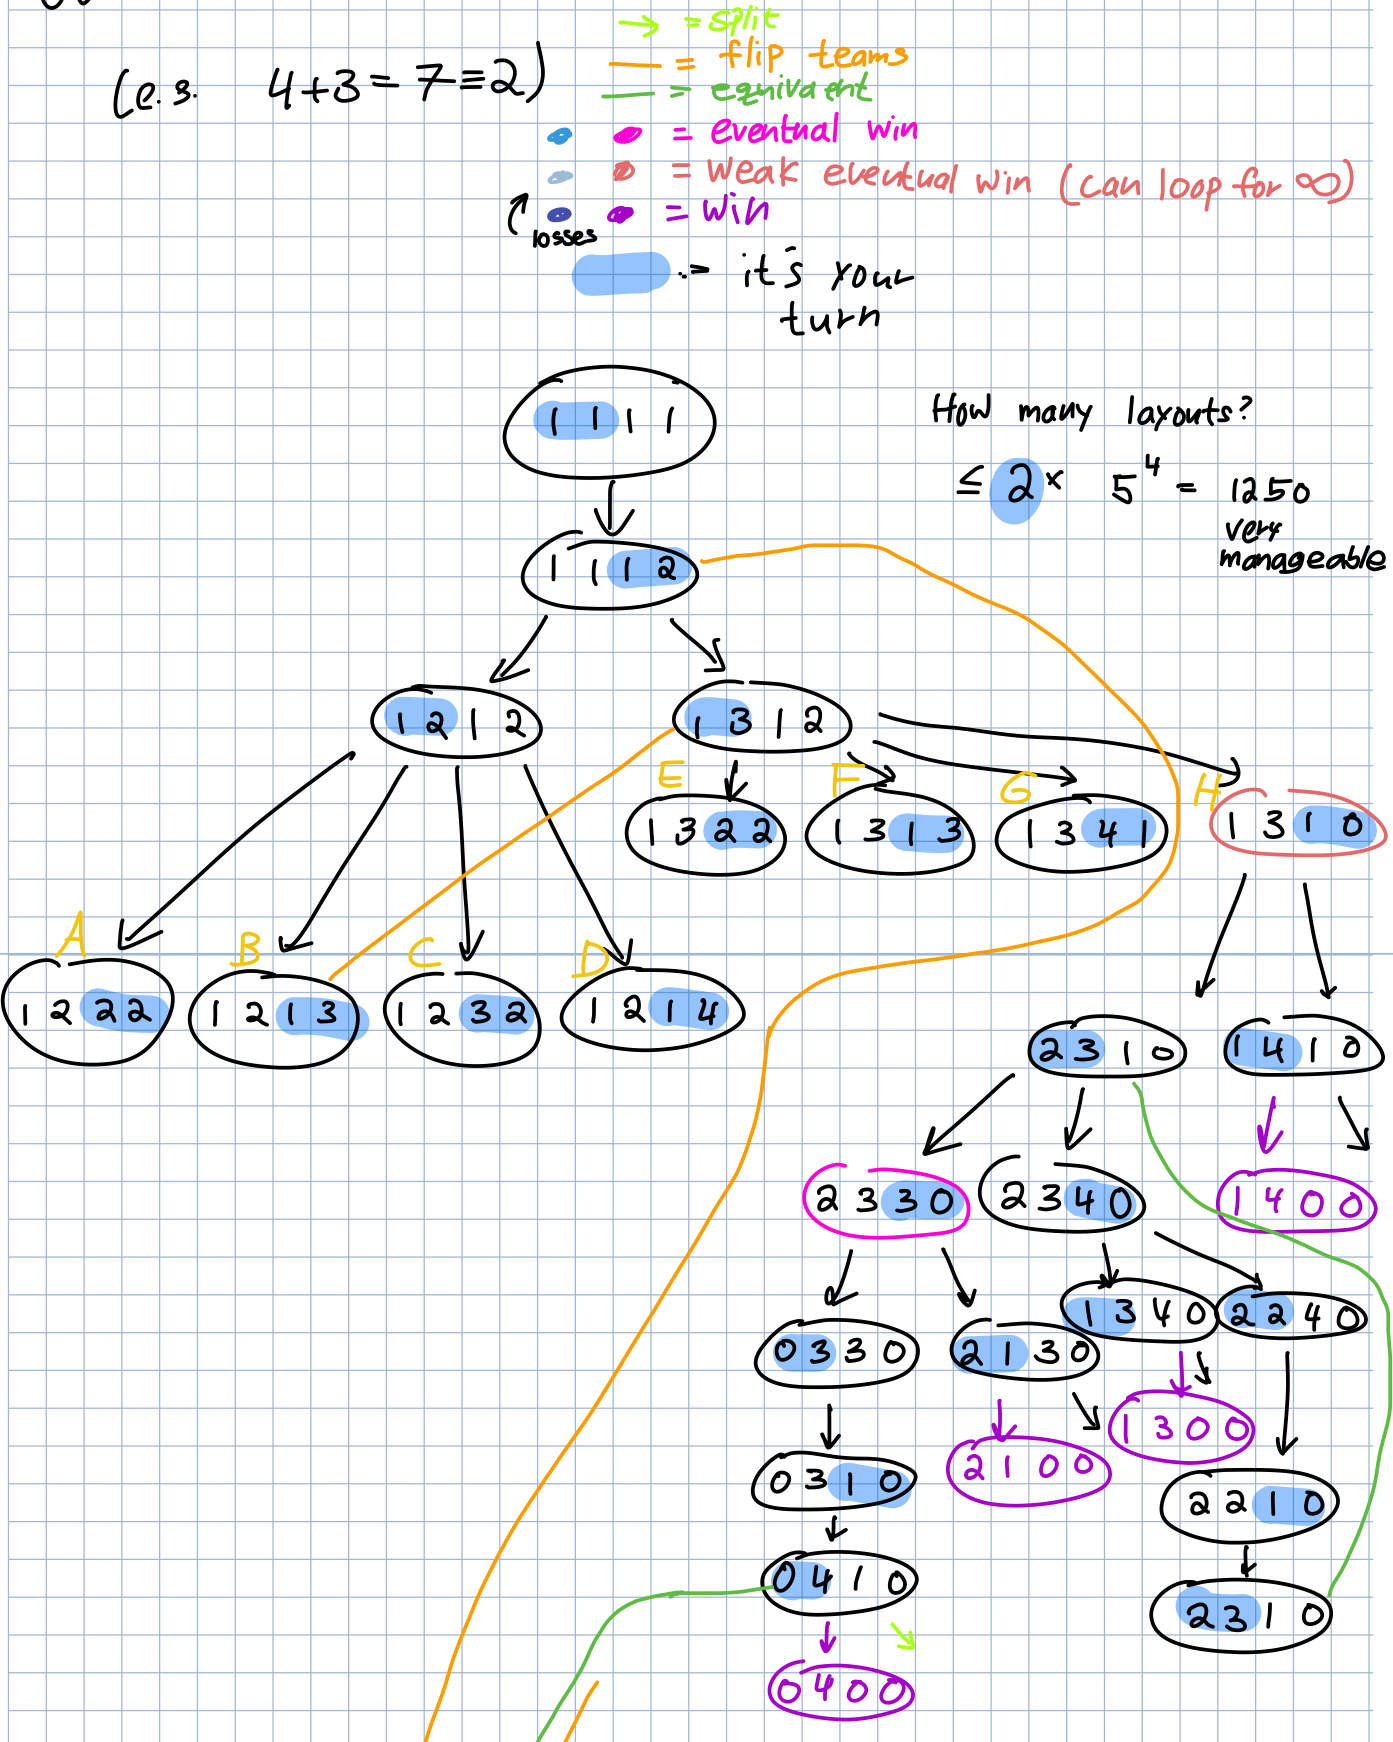
At first, it seemed like maybe writing this map out by hand could work. I was able to finish drawing all of one branch in 10 minutes, so the rest of the map couldn’t take long, right? How much could this thing expand, anyway?!
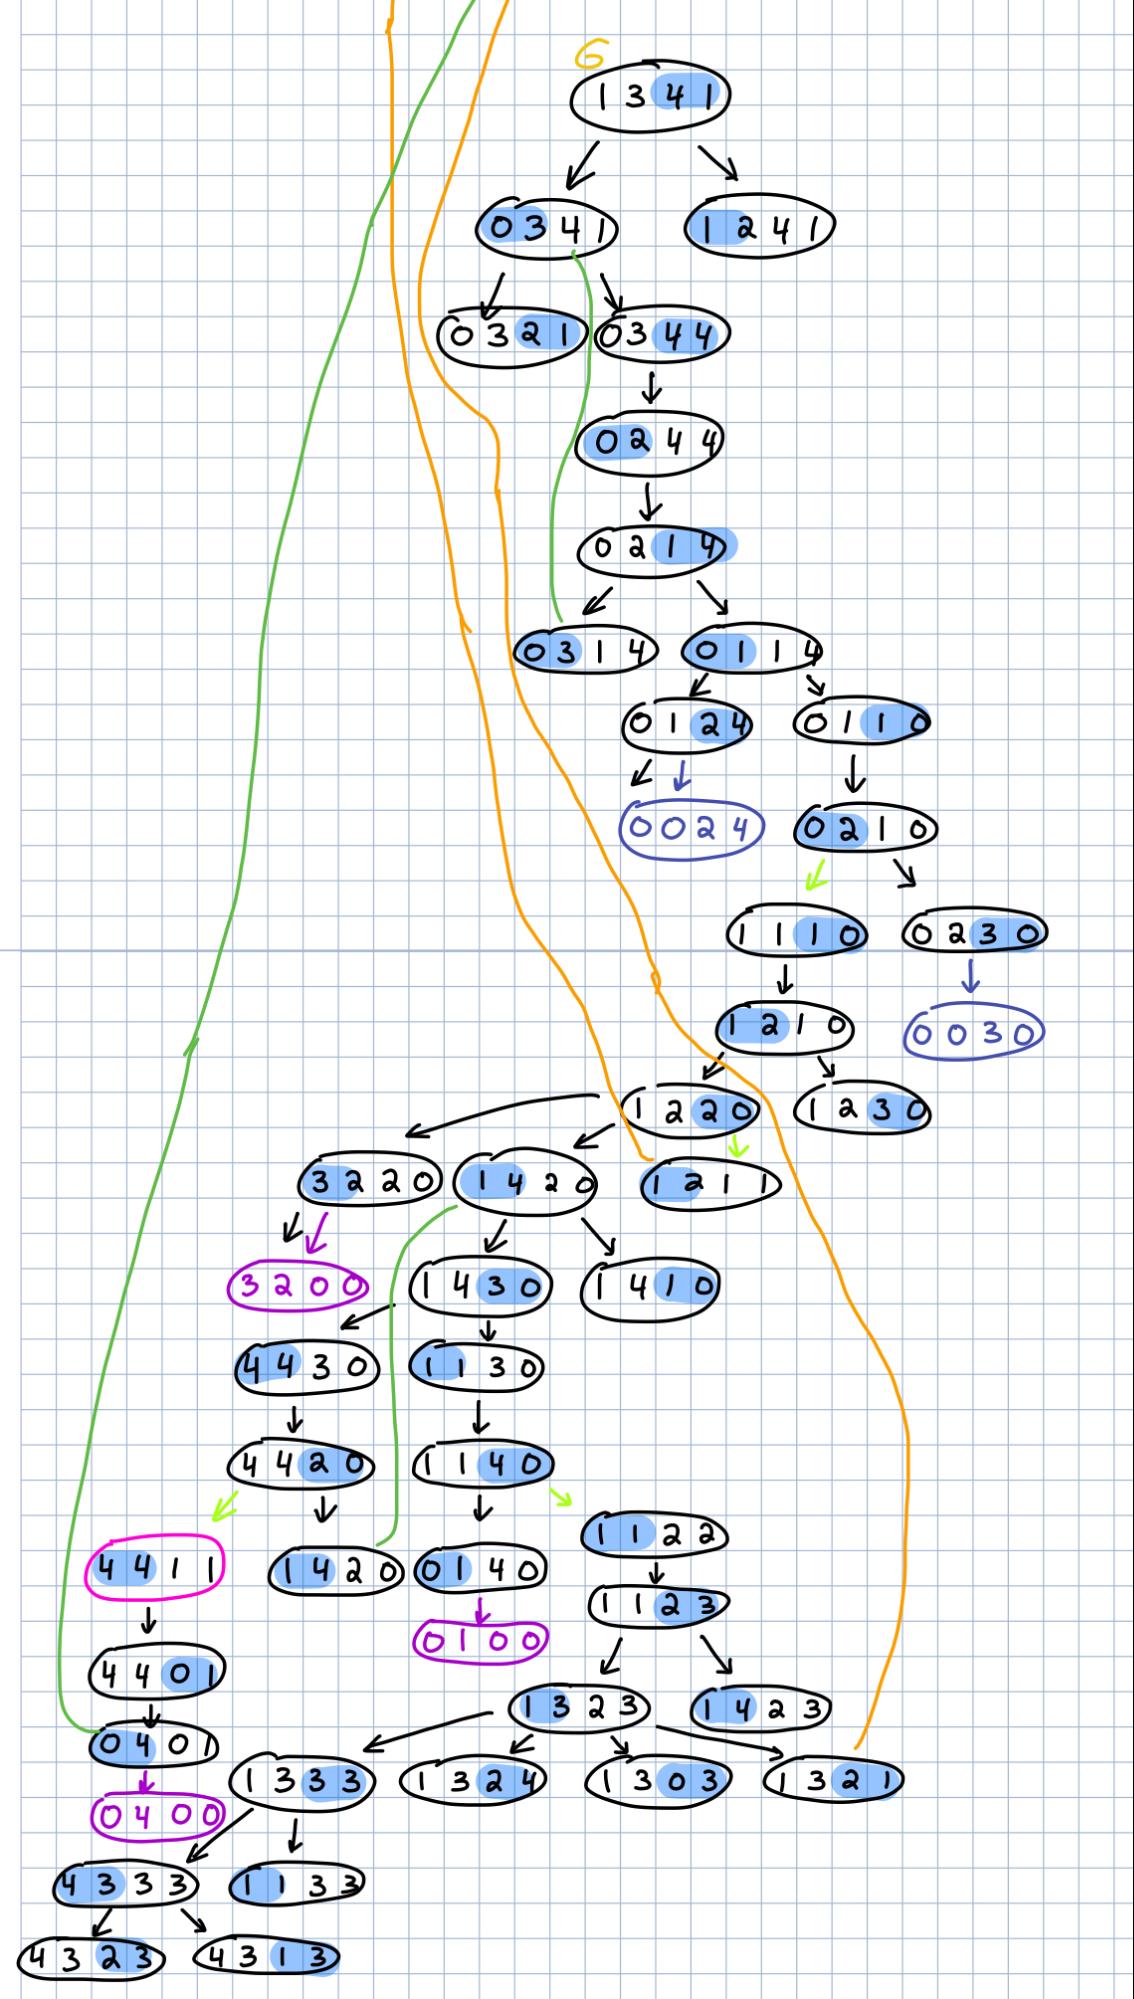
Famous last words. I was going to need to use a computer for this. I did a quick back-of-the-envelope calculation, and there’d be a large number of gamestates, but no more than 1250. Armed with this information, I got ready, got set, and …forgot about the project for two months.
Then, one weekend in November, I was struck with the sudden desire to avoid my homework using chopsticks, so I pulled a series of all-nighters that yielded:
- A program that is just the game of chopsticks. If you wanted to, you could run it to play with a friend.
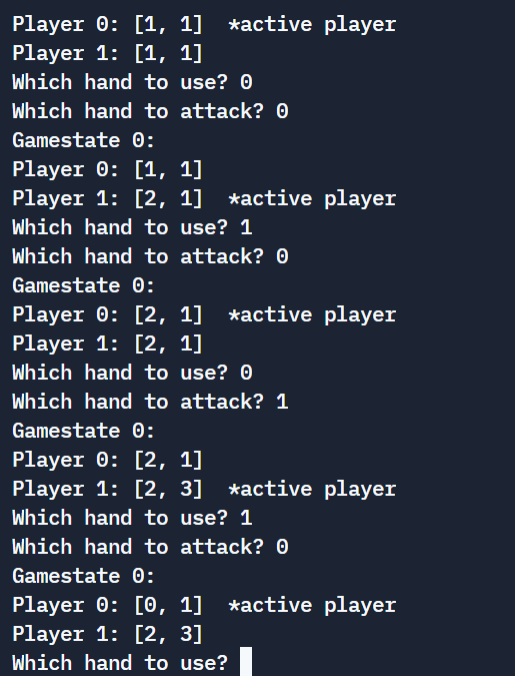
- A program that’s like a chopsticks mapper. It uses the first program to play games of chopsticks with itself, mapping every single gamestate it visits. It’s sorta like Doctor Strange foreseeing all possible futures.

[Except this program was BROKEN because, in a surprising turn of events, staying up two nights in a row is not conducive to writing idiomatic, bug-free code. (I’m shocked too.)]
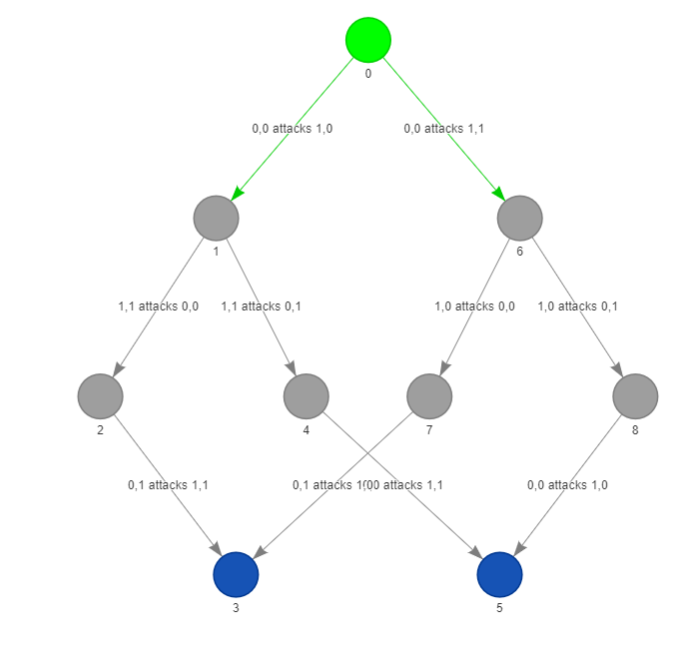
And then I didn’t touch the project until winter break, another month later. Working more methodically, I fixed up all my bugs, and the mapper was complete. My program now recorded a list of all possible gamestates. All that was left was to display it. I started experimenting with writing some code to do this. I started off very simple, with a modified version of chopsticks where hands die as soon as they get two fingers:
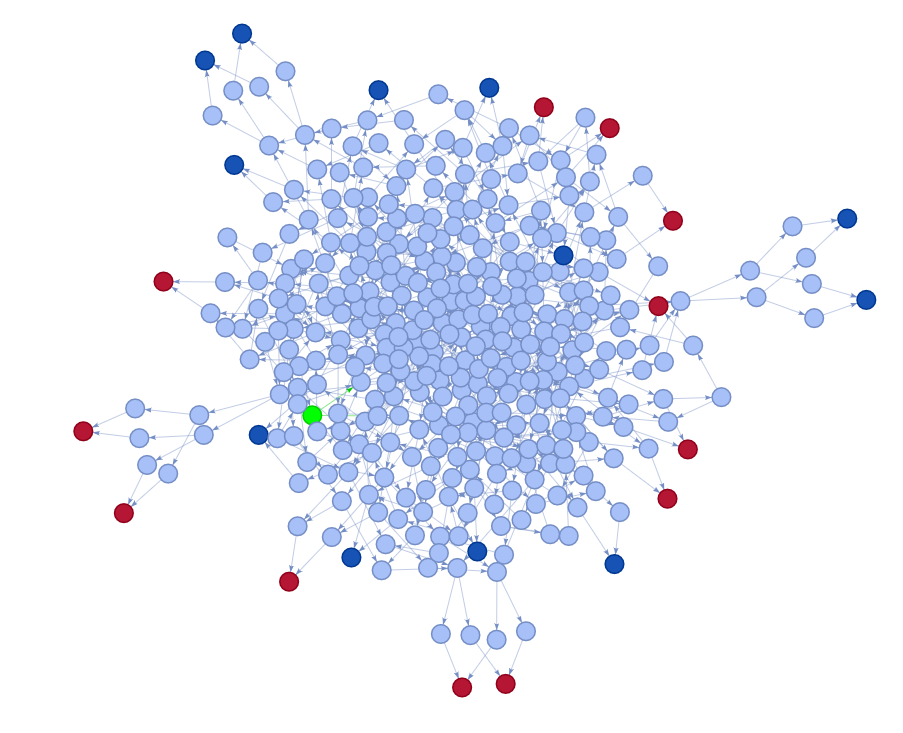
As I gained confidence in my code, I slowly increased the number of fingers the hands could hold. Below is the graph where hands die once they have 4 fingers:
And finally, at last, after fixing more bugs and adding more color-coding rules, I was able to display the graph I’d originally started drawing in Notability four months earlier!
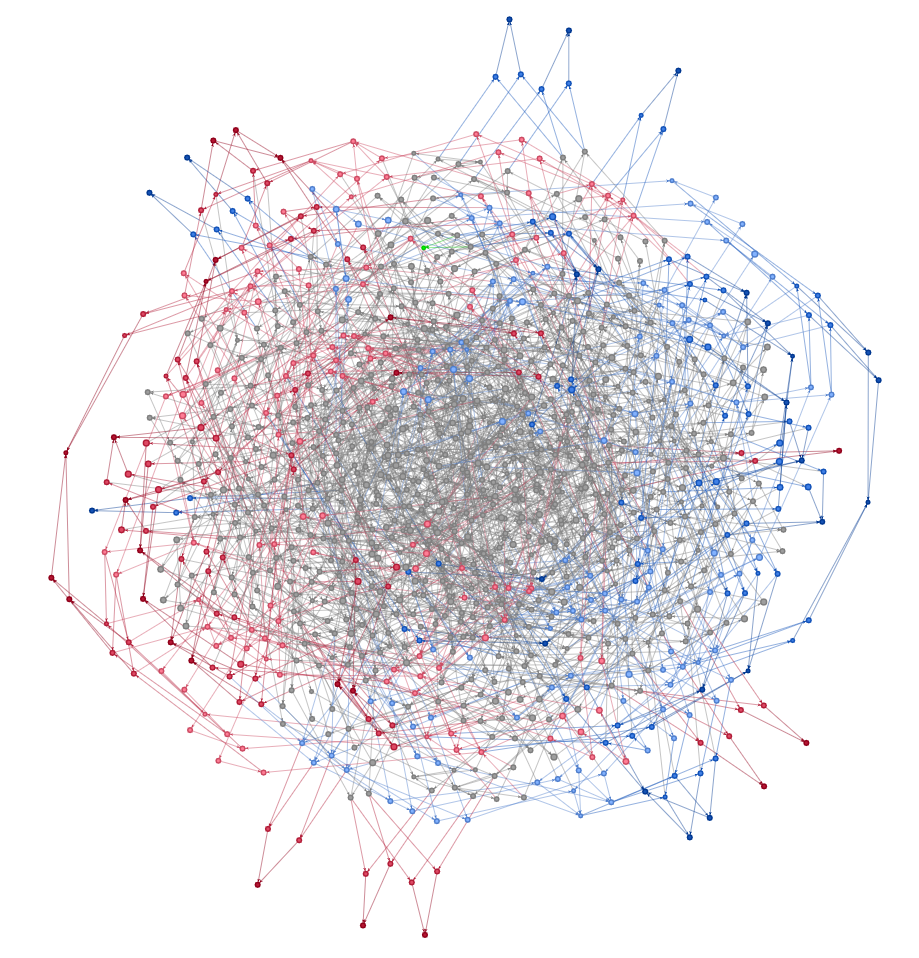
Yeah, I’m glad I’m not drawing this by hand. One thing that I find especially cool is the symmetry that arises in the graphs. The graphs automatically arrange themselves into shapes that minimize the distance between connected dots, but without cramming in too densely. The dots are like repelling magnets, but the arrows act like springs that hold connected dots together. At first glance, the graph looks really tangled and chaotic, but upon closer inspection, you can see some intriguing tangly-but-ordered behavior that reminds me of DNA wound up in chromosomes. Neato!
So to recap, we’ve gone from wondering about chopsticks on the bus, to painstakingly drawing a diagram, to creating some code that can draw the whole map (and other related, but different maps) in about a minute. What’s next? Who knows? I could probably do some work to make the map easier to read, I could do some fancy math on the graph to gain some more insights on the chopsticks meta, or I could even maybe use the map to build an ultimate chopsticks-winning bot that will CRUSH YOU EVERY TIME!
Q: Okay, cool story, bro. But like, why should we care?? What’s the point of this whole Chopsticks deal?
A: Well, there kinda wasn’t a point at first, apart from me wanting to beat people at my favorite finger game. But over time, as I’ve kept pursuing this project, it’s snowballed and snowballed, and now it’s become the largest project I’ve ever coded. I think that this experience reaffirms for me how rewarding it can be to be “impulsive” with your learning. I think we’ve all (at least once) found ourselves tempted to dive down a rabbit hole, until another, “responsible”, part of us says you need to get on with your work instead. That’s really unfortunate, because these self-paced investigations are often the sources of the knowledge I’m most proud of.
Looking back at the work I’ve done so far, I’m glad that this project has been a self-guided thing. There’s no rubric here. If this were a school project, I probably would’ve just rushed it and called it done as soon as it spat out the first graph. But, since I’ve allowed myself plenty of time to work, I’ve been able to avoid burnout and take my time reading a lot of documentation and Wikipedia articles. I’ve learned a lot.
Sometimes it’s easy to get caught in the rut of doing school just for the purpose of doing school. Ultimately, though, all that learning is to enrich your life, so have some fun with it. Google that random thing! Binge that stonemasonry channel! Develop that strangely deep knowledge of an obscure topic that speaks to you! Depth-first learning is where it’s at!
Now go forth and be curious!!!!!
PS: If you wanna play with my graphs (they’re interactive and bouncy) and see some more explanation, check out this example/explanation page.
PPS: if you wanna look at my code, it’s on github, and you can more easily play around with it on replit.